
Source diagnosis
We map data, systems, spreadsheets, manual flows and places where errors appear.
BeeLogic / IT services supporting the core offer
Data do not have to be a separate, heavy project. They are often the layer that gives meaning to an application, customer portal, e-commerce or B2B platform: showing results, automating reports and helping make decisions without guessing.
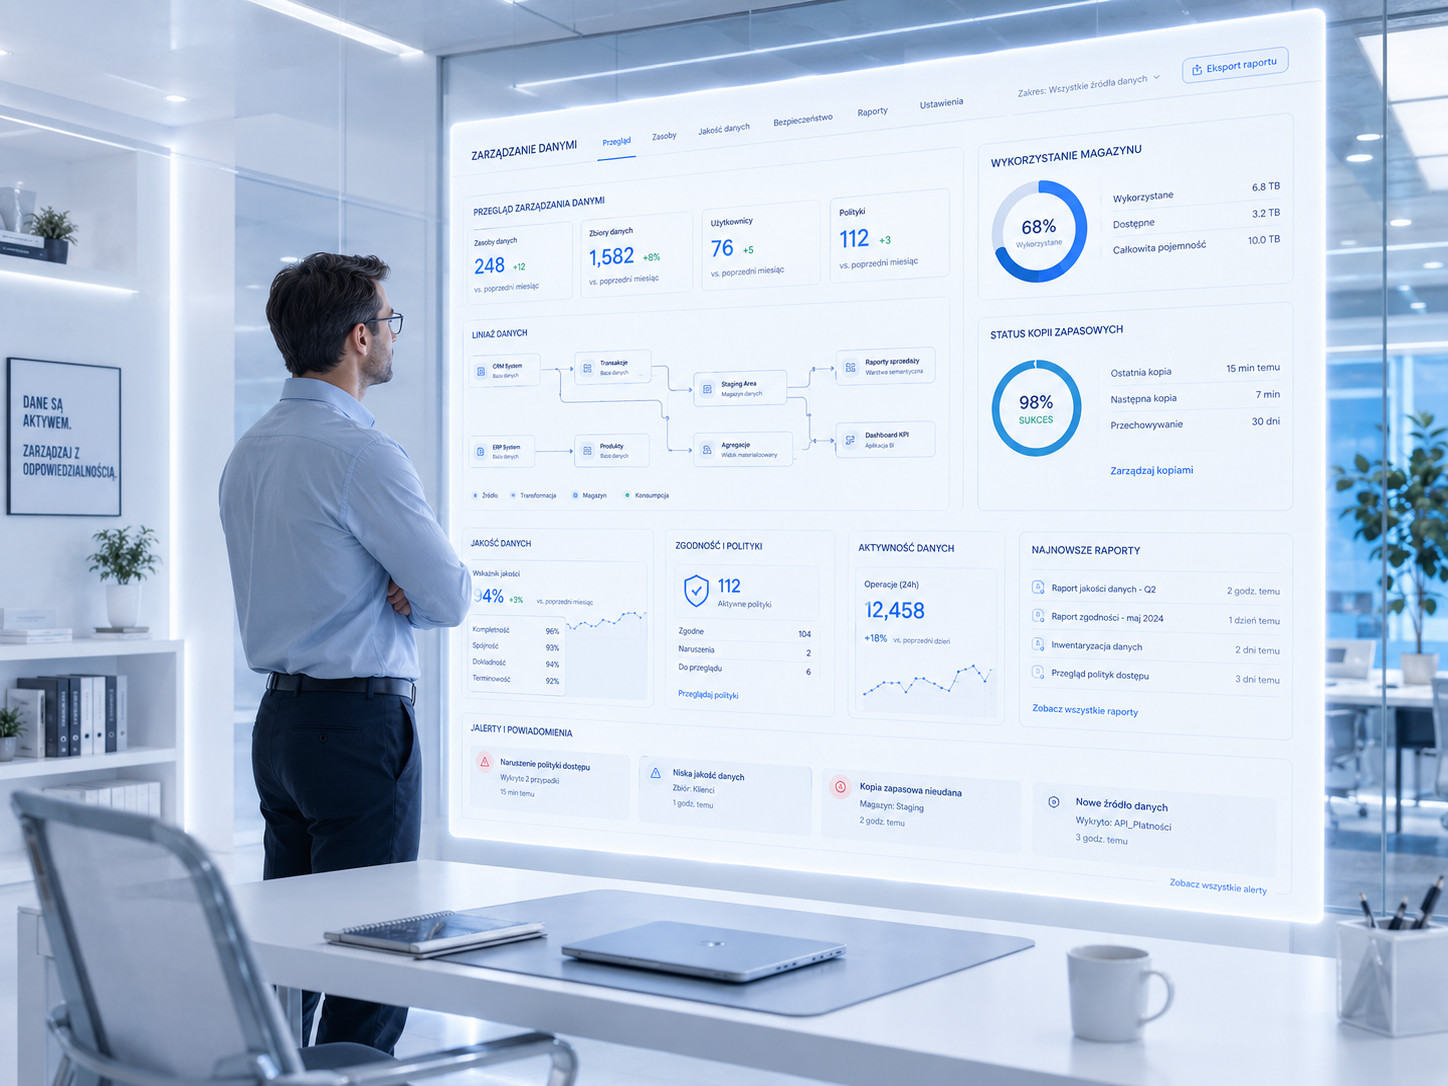
That is why we begin with the question of what the company really wants to see, which decisions it wants to make faster and which signals it should react to immediately. Only then do we organize data sources, integrations, view structure, access levels, reporting logic and the way information is presented. A dashboard makes sense when it organizes the process, shortens the path to a decision and shows data in the context of the team’s work. Without that, it is just another screen that looks good but does not change how the company operates.
First we organize sources and logic. Then we build a view that can work in an application, portal, B2B panel or separate dashboard.
We do not start with charts. We start with information logic: where the data come from, who is responsible for them, how often they change and which decision they should support.
We map data, systems, spreadsheets, manual flows and places where errors appear.
We design the structure, permissions, relationships and rules that organize the data.
We create dashboards, exports, summaries and views for specific roles.
We connect data with an application, portal or process to reduce manual information transfer.
When the company already operates, but information is scattered, reports are created manually and decisions require constant data collection from many places.
The team spends time assembling data in spreadsheets instead of making decisions.
Sales, warehouse, service, documents and finance do not speak one language.
Management or the team cannot quickly see the situation without asking for more summaries.
Data begin to support sales, customer service, operations, logistics and management. Not as a separate decorative module, but as a layer that gives the company more control.